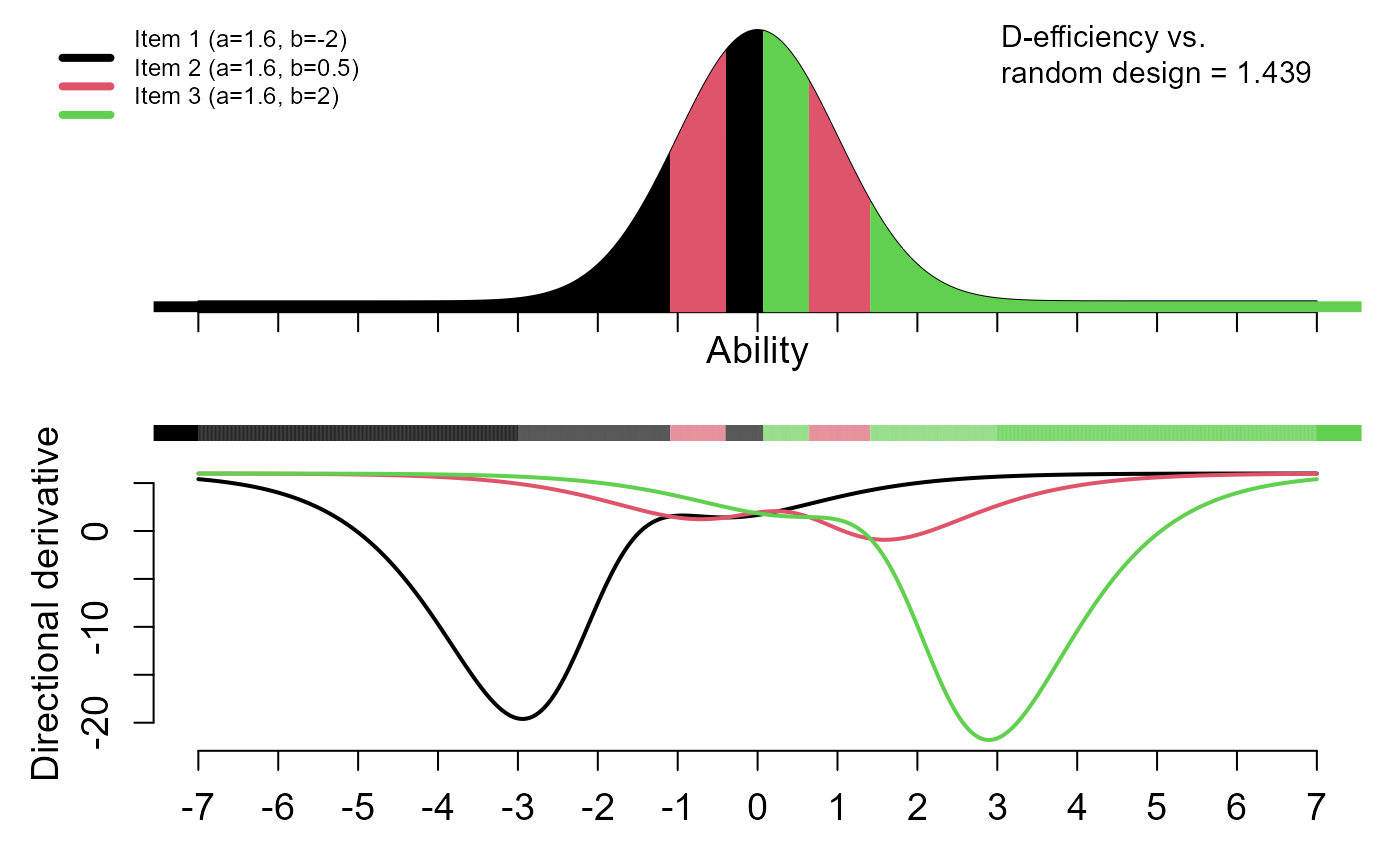
Generates a plot for the optimal design within each block, showcasing six possible layouts. All layouts feature the design first, including efficiency versus random design, followed by a line representing the item with the minimal directional derivative.
drawdesign(
  yyy,
  ablim = 7,
  ylowl = -9999999,
  refline = 0.002,
  textout = TRUE,
  itemnum = NA,
  layout = 1,
  colvec = 1:12
)
Arguments
- yyy
- ablim
ability limits; plots will be made in the range [-ablim, ablim].
- ylowl
y low level (minimum value of directional derivative shown in the plot).
- refline
reference line corresponding to desired minimum violation of equivalence theorem.
- textout
If textout=TRUE (default), the item parameters will be printed if number of items $<5$ and the efficiency vs. the random design; if textout=FALSE, no such text is printed.
- itemnum
number of items.
- layout
layouts of plots.
Layout 1: third panel has directional derivatives (cut at ylowl or lowest value of dirdev).
Layout 2: third panel has violations of equivalence theorem, should be ideally small. Stopping criterion could be <0.002 (refline).
Layout 3: third panel monitors efficiency of design vs. iteration number.
Layout 4: third panel monitors violations of equivalence theorem vs. iteration number.
Layout 5: third panel shows item characteristic curves.
Layout 0: only one panel with design.
- colvec
vector of color sequence for items (default is the R-default black, red, green, etc.)
Value
An optimal design plot is displayed.
See also
Examples
# Example No.1
# 2PL-model for three items with parameters (a, b) equal to (1.6, -2), (1.6, 0.5),
# and (1.6, 2) for the first, second, and third items, respectively.

a<-c(1.6,1.6,1.6); b<-c(-2,0.5,2)
ip <- cbind(a,b)
yyy <- optical(ip)
drawdesign(yyy, ylowl=-1000, refline=0.002)


if (FALSE) {

# Example No.2
# 2PL-models for six items; the parameters for these items are a=(1.62, 1.4, 0.98, 0.66, 0.92, 0.9),
# and b=(-0.47, -1.71, 0.62, -0.15, -1.71, 1.6), respectively.

a<-c(1.62, 1.4,0.98,0.66,0.92,0.9); b<-c(-0.47,-1.71, 0.62,-0.15,-1.71,1.6)
ip<-cbind(a,b)
bid<-c(1,1,1,2,2,2)
yyy <- optical(ip,BID=bid,show_progress=2)

drawdesign(yyy, ylowl=-1000, refline=0.002, layout=5)

}
if (FALSE) {
# Example No.2
# 2PL-models for six items; the parameters for these items are a=(1.62, 1.4, 0.98, 0.66, 0.92, 0.9),
# and b=(-0.47, -1.71, 0.62, -0.15, -1.71, 1.6), respectively.
a<-c(1.62, 1.4,0.98,0.66,0.92,0.9); b<-c(-0.47,-1.71, 0.62,-0.15,-1.71,1.6)
ip<-cbind(a,b)
bid<-c(1,1,1,2,2,2)
yyy <- optical(ip,BID=bid,show_progress=2)
drawdesign(yyy, ylowl=-1000, refline=0.002, layout=5)
}